
Contents:
Frequently Asked Questions
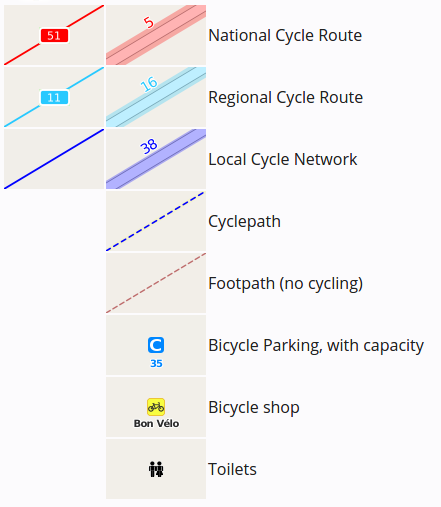
Map key
The cycle map legend below describes the map symbols and lines:
The main maps on this site come from a project called OpenCycleMap (which is part of the OpenStreetMap (OSM) project).
 How is the CO2 saving calculated?
Journey listings indicate how much cabon dioxide (CO2) is avoided by cycling the journey in comparison to how much is generated by driving the equivalent distance in a small petrol-powered car. The calculation is based on a CTC article that suggests the average saving of CO2 by cycling compared to driving a 100 mile car journey is 30kg.
We have had the following feedback about this:
"It seems to me that the CO2 saved should not based on driving the equivalent distance in a car vs. a bicycle. Rather it should be the difference between the most suitable car journey available and the chosen cycle journey. E.g. on getting directions from Stapleford to The Babraham Institute the quietest route is impossible for a car, so the saving in CO2 should reflect this, i.e. the saving should be much higher. This level of refinement may be tricky, but it is worth bearing in mind."
In response, in practice cycling will be more direct for some routes and less direct for others (e.g. when avoiding main routes), so in practice we think this is likely to be averaged out.
A related article of possible interest: How far do I have to ride my bike to pay back its carbon footprint?, the answer is "around 400 miles to cover the bike's initial carbon footprint.".
 How are the calories burned calculated?
An estimate of the calories burned on a journey was introduced to some versions of CycleStreets in Dec 2010. The figure given in the journey listing is an estimate of the amount of energy required to complete the journey. It makes these assumptions:
- Combined weight of the rider and their bicycle is 90kg
- No headwind during the journey
- Gender and age neutral
- The rider is 24% efficient at converting their food energy into power at the pedal (this is a good figure for a fit, athletic person)
- Sections of the route that are walked are assumed to use the same energy as if they were ridden
- The kinetic energy gained in going downhill is not carried over into the next flat or uphill section.
The resulting figure is shown in Calories (actually kcal) in the journey listings on those sites that provide this feature.
Calculations are based on this wikipedia reference and a spreadsheet from CTC (no longer listed on their site). They use this formula:
P = g * m * Vg * (K1 + s) + K2 * Va2 * Vg
In this formula, the power is made up of three components:
- Rolling resistance, (K1) from tyres, bearings and chain.
- Rate of climbing, (s) which can be positive or negative, depending on whether going up or down hill.
- Air resistance, (K2) which depends strongly on the rider's speed relative to the wind.
| Parameter | Description | Units | Value |
|---|---|---|---|
| P | Power | Watts | |
| g | Earth's gravity | m / s2 | 9.81 |
| m | Mass of rider and bike inclusive | kg | 90 |
| Vg | Ground speed | m/s | 12 mph is about 5.4 m/s |
| s | Grade or slope | % | assumed to be flat, ie. zero |
| K1 | A lumped constant for the rolling resistance | dimensionless | 0.0053 (equivalent to a slope of 0.5%) |
| K2 | A lumped constant for aerodynamic drag | kg/m | 0.26 see note |
| Va | The rider's speed through the air | m/s |
Note: The wiki reference quotes K2 = 0.185 kg/m, but that is for an aerodynamic bike with a drag coefficient of 0.7. The value of 0.26 is based on a drag coefficient of 1.0.
On the flat (s=0) at 12 mph ( = 5.4 m/s), when there is no wind this gives a power of:
P = 9.8226 * 90 * 5.4 * (0.0053 + 0) + 0.26 * 5.42 * 5.4 = 66.2 Watts
To convert this into energy burned by the rider, we note that 1 joule is approximately 0.000239 kilocalories (kcal) and an athletic human body is 24% efficient. The conversion factor is then 0.000239 / 24% = 0.001, and so in this example our rider burns approximately 0.07 kcal per second. On a 20 minute ride they would burn 80 kcal.
A raw eating apple has about 50 Calories.
Why has it sometimes produced an odd route?
The journey planner sometimes fails to find a route or produces a strange route. These are the main reasons why, which we continue to work to improve:
- Undiagnosed:
- There is some sort of problem with the route, but exactly what has yet to be determined.
Notes:
- The current limit on journey length is 186 miles, 300km.
- Naismith's Rule suggests how hilly terrain affects speed.